Climate Change and the Economy
Gary W. Yohe, Huffington Foundation Professor of Economics and Environmental Studies, has been working at the forefront and intersection of two critical fields of study.
Back in 1981, Gary Yohe received a life-changing phone call. At the time, Yohe was a recently tenured economics professor at Wesleyan working on applied microeconomic theory; the call came in from William Nordhaus, his dissertation advisor and mentor at Yale, inviting him to join a National Academy of Sciences study on climate change.
“At that point, there were perhaps only five economists on the planet who knew anything about climate change,” Yohe recalls.
In many ways, the study represented the birth of the field to which Yohe has dedicated the past four decades of his career. His research—which was recognized last fall with Wesleyan’s inaugural Prize for Excellence in Research—examines the economic impacts of climate change, as well as strategies for mitigating the greenhouse gas emissions that are its source. Beyond his prolific writing in scholarly publications and the mainstream media, Yohe has also commissioned environmentally themed raps with Baba Brinkman, and served as vice chair of President Barack Obama’s Third National Climate Assessment and as a senior member of the Intergovernmental Panel on Climate Change (IPCC). The latter earned him a share of the 2007 Nobel Peace Prize.
In 2018, he was involved in another Nobel ceremony when Nordhaus was awarded the Nobel Memorial Prize in Economic Sciences and invited Yohe—his career-long collaborator in the integrated assessment of climate change—to accompany him to Nobel Week in Stockholm as one of four nonfamily members of the “Climate Club—Stockholm 2018.”
In his research, Yohe (who will retire from teaching at Wesleyan at the end of the academic year) describes himself as a “consumer” of data produced by federal agencies like NASA and NOAA, as well as the 169 member-nations of the United Nations Framework Convention on Climate Change. But, he says, using data to convince the public of the urgency of climate change can be tricky.
“In an era where science has been dismissed as irrelevant and false, we have to be very careful,” he says. “One mistake arguing that the climate issue is existential for the planet can be fatal.
“Most Americans learn about the effects of climate change on TV or on social media, but many see the effects from their kitchen windows. These amateur observers, as well as the climate change community, need to be careful about attributing every extreme weather and climate event to human emissions of greenhouse gases. But, recent forensic attribution suggests that much of the damage from recent severe hurricanes, wildfires in the West, and the fracturing of the Arctic vortex can all be linked to higher concentrations of heat-trapping gases. The data and the underlying analyses are convincing, and the growing number of amateurs are right.”
“The rising temperatures in Alaska are most troubling on a global scale,” says Yohe, “because that is where the floating ice in the Arctic starts to melt and the tundra starts to emit captured methane (another greenhouse gas). Both create positive feedbacks.” He explains that “much of Alaska and northern Canada is tundra, underneath which are hundreds of millions of tons of methane. When the tundra melts, that gas is released. If we reach the point where all that methane from the northern tundra is released, the effects will be catastrophe and irreversible. In the meantime, melting of the Arctic ice sheet slowly amplifies warming because the planet is absorbing more of the sun’s energy across a blue surface rather than a reflective white surface.”
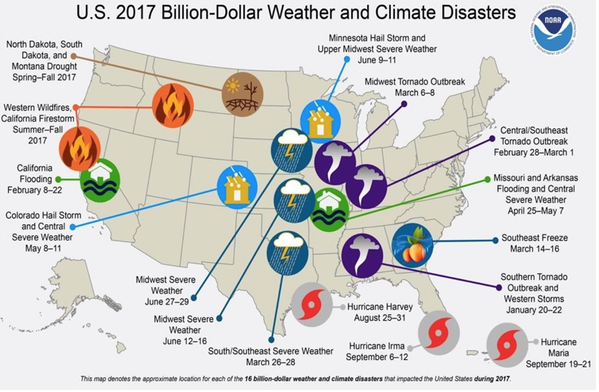
Across the past four years, Yohe explains, “We’ve been able to directly attribute the increased intensity of these disasters—and therefore the increased damages, calibrated in dollars and in human lives—to human-induced climate change.”
How does climate change affect weather and climate disasters? One cause is a change in the pattern of atmospheric currents, which results in hurricanes that do not move along their usual paths once they make landfall and do not have the oceans to tell them where to go. Rather, they stay over land in the same place for several days, dropping devastating volumes of rain.
Elsewhere, warmer ocean temperatures lend more energy to hurricanes and make them more intense. This was especially notable when several consecutive hurricanes—Harvey, Irma, and Maria—hit the same ocean in 2017. That year was historic for South Atlantic ocean temperatures, not just at the surface but several layers lower, where the water stayed as warm as the surface. This meant each consecutive hurricane found warm water, and thus plenty of energy, leading to a historic catastrophe for Puerto Rico.